
Recruiting technical talent requires more than intuition; it demands measurable benchmarks that reflect the effectiveness and efficiency of your hiring operation. IT recruitment KPIs serve as those benchmarks, offering visibility into performance across every stage of the process. From time-to-fill and sourcing channel efficiency to offer acceptance rates and candidate retention, these metrics reveal where your strategy is working—and where it’s falling short.
For hiring managers, HR leaders, and recruitment teams tasked with scaling engineering or IT functions, understanding the right KPIs is critical to maintaining hiring velocity without compromising quality. This article outlines the most relevant indicators, explains how to interpret them in context, and provides a practical framework for applying data to improve recruitment outcomes over time.
The most important IT recruitment KPIs are:
- Time to Hire
- Time to Fill
- Candidate Quality Metrics
- Offer Acceptance Rate
- Cost per Hire (CPH)
- Sourcing Channel Effectiveness
- Candidate Drop-off Rate
- Diversity Metrics
- New Hire Retention Rate
Time to Hire
Time to hire measures the number of days between a candidate entering your hiring pipeline and accepting an offer. This KPI directly impacts your ability to secure in-demand tech talent like Full-Stack Developers, Data Engineers, or Cloud Architects before competitors.
Why It Matters
Shorter time-to-hire cycles improve your chances of attracting top-tier candidates who often receive multiple offers simultaneously. For IT recruiters and hiring managers, this metric highlights inefficiencies in sourcing, screening, or decision-making processes that could delay technical hires.
How to Track
Use applicant tracking systems (ATS) such as Greenhouse or Lever to log timestamps for each stage, sourcing, skills assessment, interviews, and final offer acceptance. Compare these durations across roles like QA Analysts versus Network Engineers to identify bottlenecks specific to certain positions.
Optimization Strategies
- Streamline Screening: Automate initial vetting using tools like Codility or HackerRank for coding assessments.
- Enhance Collaboration: Ensure hiring managers and technical sourcers align on job descriptions and evaluation criteria upfront.
- Leverage Pre-Vetted Talent Pools: Partner with IT recruitment agencies specializing in pre-screened candidates for roles such as DevOps Engineers or Mobile App Developers.
Tracking time-to-hire helps you refine your recruitment funnel while minimizing risks of losing qualified candidates due to prolonged delays.
Time to Fill
Time to fill measures the number of days between a job requisition’s approval and the acceptance of an offer by a candidate. This KPI evaluates how efficiently your IT recruitment process moves from sourcing to onboarding.
Why It Matters
A long time to fill increases risks of losing in-demand tech talent, such as Full-Stack Developers or Cloud Architects, who often receive multiple offers. Delays also disrupt project timelines for roles like QA Analysts or Data Engineers, impacting operational efficiency.
Factors Influencing Time to Fill
- Role Complexity: Positions requiring niche skills, like LLM Post-Training Specialists or DevOps Engineers, extend hiring durations due to limited talent pools.
- Sourcing Channels: Inefficient use of platforms like LinkedIn Recruiter or GitHub slows down candidate identification.
- Screening Bottlenecks: Manual resume reviews and delayed technical assessments on tools like HackerRank or Codility create unnecessary lags.
How to Optimize Time to Fill
- Leverage Automation: Use ATS platforms like Greenhouse or Lever for automated tracking and pre-screening workflows.
- Expand Talent Pools: Source remote-ready candidates from nearshore regions such as Latin America or Eastern Europe using Boolean search techniques and specialized IT recruitment agencies.
- Streamline Collaboration: Foster real-time communication between technical sourcers, engineering managers, and CTOs during candidate shortlisting phases.
Tracking this metric helps you identify inefficiencies in your hiring pipeline while ensuring critical positions are filled promptly without compromising quality standards.
Candidate Quality Metrics
Tracking candidate quality metrics ensures your IT recruitment efforts attract skilled, culture-fit tech talent. These metrics evaluate the effectiveness of sourcing, screening, and hiring processes while aligning with long-term business goals.
1. Pre-Vetted Talent Ratio
The pre-vetted talent ratio highlights how many sourced candidates meet technical and cultural requirements before interviews. High ratios reflect efficient sourcing strategies through platforms like LinkedIn Recruiter or GitHub. If less than 30% of shortlisted QA Analysts pass initial screenings, adjust Boolean search strings or leverage ATS-integrated skills assessments like Codility.
2. Candidate-to-Hire Ratio
This KPI tracks how many candidates proceed from application to hire. Ratios above industry standards (e.g., >10:1 for Software Developer roles) suggest inefficiencies in screening tests or interview rubrics. Streamline these steps by automating technical evaluations using HackerRank or Workable.
3. First-Year Retention Rate
Retention rates measure how many hires remain employed after one year. Low retention among DevOps Engineers could signal poor onboarding experiences or mismatched skillsets during hiring stages. Collaborate with engineering managers to align job matching criteria with team needs.
4. Technical Assessment Pass Rate
This metric assesses the percentage of candidates passing coding challenges or practical exams during screening phases. If fewer than 50% of Mobile App Developers s쳮d on HackerRank tests, recalibrate difficulty levels based on required experience tiers (e.g., junior vs senior-level).
Analyzing these metrics helps you optimize IT staffing pipelines and secure high-quality hires efficiently across diverse roles such as Front-End Developers and Database Managers in nearshore or remote setups.
Offer Acceptance Rate
Offer Acceptance Rate measures the percentage of candidates who accept job offers after completing the recruitment process. This KPI directly reflects the effectiveness of your IT recruitment strategy in attracting and securing top tech talent.
Why It Matters
A low offer acceptance rate signals misalignment between candidate expectations and your hiring proposition. For roles like Software Developer, QA Analyst, or Cloud Architect, this could mean losing skilled professionals to competitors offering better compensation, benefits, or work environments. Tracking this metric helps identify gaps in employer branding, salary benchmarks, or cultural fit during technical hiring.
How To Calculate
Divide the number of accepted offers by the total offers extended within a specific period. Multiply by 100 to express it as a percentage:
Offer Acceptance Rate (%) = (Accepted Offers / Total Offers) × 100
For example, if you extend 20 offers for Full-Stack Developers and 15 are accepted, your offer acceptance rate is 75%.
Factors Impacting Offer Acceptance
- Compensation Packages: Competitive salaries and equity options attract senior-level developers and IT project managers. Benchmark against industry standards using platforms like LinkedIn Salary Insights or Glassdoor.
- Candidate Experience: A smooth interview process increases acceptance rates. Delays in scheduling technical interviews through ATS tools like Greenhouse can frustrate candidates.
- Role Clarity: Clear job descriptions ensure candidates understand responsibilities before accepting an offer.
- Work Flexibility: Remote-ready roles appeal to bilingual engineers from nearshore regions like Latin America or Eastern Europe.
Strategies To Improve
- Use data-driven insights from sourcing tools like HackerRank to align skill assessments with market demands for specialized roles such as LLM Post-Training Specialists or Data Engineers.
- Enhance collaboration between IT recruiters and engineering managers to address candidate concerns promptly during negotiations.
- Leverage feedback loops via post-offer surveys conducted through HR tech platforms like Workable to refine future approaches.
Tracking offer acceptance rates ensures efficient use of resources while improving outcomes across IT staffing efforts for critical positions in DevOps hiring or database management teams.
Cost per Hire (CPH)
Cost per hire (CPH) measures the total financial investment required to fill a specific IT role. This KPI includes expenses such as job board fees, LinkedIn Recruiter licenses, ATS subscriptions like Greenhouse or Lever, technical assessment tools like HackerRank or Codility, and IT recruitment agency fees. It also accounts for internal costs, including salaries of tech recruiters, hiring managers, and technical sourcers involved in the process.
Why CPH Matters in IT Recruitment
Tracking CPH helps you allocate resources effectively while maintaining cost-efficiency in your hiring pipeline. High CPH can indicate inefficiencies in sourcing channels or screening processes. For example, over-reliance on premium platforms like Stack Overflow Talent without leveraging free sourcing tools may inflate costs unnecessarily. Monitoring this metric ensures that your IT staffing strategy aligns with budget constraints without compromising candidate quality.
Calculating Cost per Hire
To calculate CPH:
CPH = (External Costs + Internal Costs) ÷ Total Hires
- External Costs: Job ads, sourcing tools (e.g., Boolean search software), third-party recruiter fees
- Internal Costs: Salaries of team members managing sourcing, screening, interviewing, and onboarding
For instance, if external costs amount to $15,000 and internal costs are $10,000 for recruiting five Software Developers within a quarter:
CPH = ($15,000 + $10,000) ÷ 5 = $5,000 per hire
Reducing Cost per Hire Without Sacrificing Quality
- Automate Screening Processes: Use ATS platforms to streamline candidate shortlisting based on predefined criteria.
- Leverage Pre-Vetted Talent Pools: Partner with nearshore or offshore IT recruitment agencies specializing in pre-vetted bilingual candidates from regions like Latin America.
- Optimize Sourcing Channels: Combine paid platforms with open-source communities such as GitHub and Reddit’s programming forums to attract diverse talent pools at lower costs.
- Enhance Employer Branding: Improve job descriptions and showcase work flexibility to reduce dependency on costly headhunting services by attracting inbound applications.
Monitoring CPH allows you to scale technical hiring efforts efficiently across roles like QA Analysts or Cloud Architects while staying within budgetary limits critical for business growth objectives.
Sourcing Channel Effectiveness
Measuring sourcing channel effectiveness helps you identify which platforms or methods deliver the best tech talent for your IT recruitment efforts. By analyzing performance data, you can allocate resources to high-performing channels and reduce inefficiencies in your hiring pipeline.
Key Metrics to Track
- Source-to-Hire Ratio
This metric calculates the percentage of hires generated from a specific sourcing channel, such as LinkedIn Recruiter, GitHub, or Stack Overflow. A low ratio indicates poor-quality leads or misaligned targeting on that platform.
- Cost per Source
Evaluate how much you’re spending on each sourcing channel relative to its output. For example, if an IT recruitment agency delivers more pre-vetted candidates than internal sourcing tools like Boolean search, it may justify higher costs.
- Candidate Quality by Channel
Assess candidate quality using metrics like technical assessment pass rates and interview success rates across different sources. Channels producing culture-fit and technically skilled hires—such as HackerRank or Codility—should be prioritized.
- Time-to-Engage
Measure the average time taken to contact candidates after identifying them through a specific source. Faster engagement times often lead to better response rates, especially for in-demand roles like Full-Stack Developers or Data Engineers.
- Diversity Contribution
Analyze how effectively each channel supports diversity hiring goals by tracking demographic data where legally permissible (e.g., gender representation in DevOps hiring).
Optimizing Sourcing Strategies
- Leverage Automation Tools: Use ATS platforms like Greenhouse or Lever to track candidate origins and automate follow-ups.
- Expand Talent Pools: Include nearshore and offshore regions such as Latin America or Eastern Europe for cost-effective access to bilingual, remote-ready professionals.
- Refine Job Descriptions: Tailor job postings based on insights from high-performing channels to attract relevant skillsets.
- Collaborate with Hiring Teams: Align with engineering managers and CTOs when selecting channels for specialized roles like LLM Post-Training Specialists or cloud architects.
- A/B Test Campaigns: Experiment with messaging styles on platforms like LinkedIn Recruiter versus niche communities such as Stack Overflow.
Tracking sourcing channel effectiveness ensures efficient resource allocation while improving outcomes in software developer recruitment and broader IT staffing initiatives.
Candidate Drop-off Rate
Candidate drop-off rate measures the percentage of applicants who exit the recruitment funnel before completing key stages, such as screening, technical interviews, or offer acceptance. This KPI highlights inefficiencies in your hiring pipeline and identifies areas where candidates disengage.
Why It Matters
High drop-off rates can signal poor candidate experience, misaligned job descriptions, lengthy processes, or ineffective communication. In IT recruitment, losing skilled Web Developers or Data Engineers mid-process impacts project timelines and increases time-to-fill metrics. For CTOs and engineering managers under tight deadlines, this creates operational risks.
How to Track
Use ATS platforms to monitor stage-specific abandonment rates across sourcing channels. Segment data by role type to pinpoint patterns unique to each position. Calculate the drop-off rate using:
Drop-Off Rate (%) = (Number of Candidates Exiting a Stage ÷ Total Candidates Entering That Stage) × 100
Common Causes
- Lengthy Processes: Prolonged interview cycles discourage experienced DevOps professionals juggling multiple offers.
- Miscommunication: Delayed feedback from tech recruiters frustrates Mobile App Developers expecting timely updates.
- Unclear Job Descriptions: Ambiguous expectations deter Database Managers seeking clarity on responsibilities and required skillsets.
- Ineffective Assessments: Overly complex coding tests on platforms like HackerRank may alienate even senior-level Software Developers.
Optimization Strategies
- Streamline Screening: Automate resume parsing with AI-driven tools integrated into ATS systems to reduce delays during initial vetting stages.
- Enhance Communication: Assign dedicated points of contact for roles like Network Engineers to ensure consistent updates throughout the process.
- Refine Job Matching: Use Boolean search techniques combined with pre-vetted talent pools sourced via IT recruitment agencies for better alignment between candidates and roles.
- Improve Assessment Design: Replace generic skills assessments with targeted evaluations tailored for specific positions (e.g., Codility challenges for Back-End Developers).
Tracking candidate drop-off rates helps you refine your hiring pipeline while retaining top-tier tech talent efficiently across diverse IT staffing needs.
Diversity Metrics in Technical Hiring
Tracking diversity metrics in technical hiring ensures your IT recruitment strategy attracts a wide range of qualified candidates. These metrics measure representation across gender, ethnicity, age, and other demographics within your tech talent acquisition pipeline.
Key Diversity KPIs to Monitor
- Diverse Candidate Sourcing Ratio
Measure the percentage of diverse candidates sourced from platforms like LinkedIn Recruiter, GitHub, or Stack Overflow compared to the total candidate pool. A low ratio may indicate over-reliance on limited sourcing channels or poorly targeted job descriptions.
- Interview-to-Hire Ratio for Underrepresented Groups
Track how many candidates from underrepresented groups progress through screening and technical interviews to final offers. If this ratio is lower than average, reassess interview rubrics or unconscious bias during evaluations.
- Retention Rate by Demographics
Analyze first-year retention rates segmented by demographic categories such as gender or ethnicity. High turnover among specific groups often signals cultural misalignment or lack of inclusive onboarding practices.
- Leadership Representation in Tech Roles
Evaluate the proportion of leadership positions (e.g., CTOs, engineering managers) held by individuals from diverse backgrounds. This metric reflects long-term inclusivity efforts within your organization’s career progression pathways.
- Diversity Contribution per Sourcing Channel
Assess which sourcing tools—like Boolean search techniques, ATS integrations (Greenhouse, Lever), or IT recruitment agencies—yield higher percentages of diverse applicants. Redirect resources toward high-performing channels for better results.
Strategies to Improve Diversity Metrics
- Expand Talent Pools: Source bilingual and remote-ready candidates from nearshore regions like Latin America.
- Refine Job Descriptions: Use neutral language that avoids unintentional biases and highlights culture-fit attributes.
- Leverage Blind Screening Tools: Platforms like Codility and HackerRank anonymize candidate profiles during skills assessments to reduce bias.
- Train Hiring Teams: Provide workshops for recruiters, hiring managers, and technical sourcers on identifying unconscious bias during screening processes.
- Enhance Employer Branding: Showcase diversity initiatives on company pages and social media to attract more varied applicant pools.
Monitoring these metrics helps you create an equitable hiring pipeline while maintaining access to top-tier software developers, cloud architects, QA analysts, and other critical IT roles essential for scaling operations effectively.
New Hire Retention Rate
New hire retention rate measures the percentage of IT hires who remain with your company after a specific period, typically six months or one year. This KPI directly reflects the success of your recruitment and onboarding processes in securing long-term, culture-fit tech talent.
Why It Matters
High turnover among new hires disrupts project timelines, increases costs, and strains existing teams. For roles like Software Developers, DevOps Engineers, or QA Analysts, losing skilled professionals shortly after hiring can delay product launches or compromise system reliability.
Tracking this metric helps you identify weaknesses in job matching, onboarding effectiveness, or cultural alignment during technical hiring.
How to Calculate
Divide the number of retained hires by the total number of new hires within a defined timeframe (e.g., 12 months). Multiply by 100 to express it as a percentage:
Retention Rate (%) = (Retained Hires / Total New Hires) × 100
For example, if you hired 50 Web Developers last year and 40 are still employed today, your retention rate is 80%.
Factors Impacting Retention
- Onboarding Quality: Poorly structured onboarding leads to disengagement. Use ATS platforms like Greenhouse or Workable to streamline workflows for introducing tools and team dynamics effectively.
- Role Clarity: Misaligned expectations between candidates and job descriptions result in dissatisfaction. Ensure clarity when sourcing through LinkedIn Recruiter or IT recruitment agencies.
- Cultural Fit: Candidates mismatched with organizational values often leave early. Evaluate compatibility using behavioral interview rubrics alongside technical assessments on HackerRank or Codility.
- Career Growth Opportunities: Lack of skill development pathways discourages senior-level engineers from staying long-term.
Optimization Strategies
- Enhance Onboarding Processes: Automate repetitive tasks using ATS integrations while personalizing experiences for remote-ready developers across nearshore locations like Latin America or Eastern Europe.
- Refine Job Descriptions: Collaborate with engineering managers to ensure accurate representation of required skills and responsibilities before publishing openings on GitHub Jobs or Stack Overflow.
- Leverage Feedback Loops: Conduct exit interviews with departing employees to uncover patterns affecting retention rates among Full-Stack Developers or Network Engineers.
- Promote Internal Mobility: Offer lateral moves into specialized roles such as LLM Post-Training Specialists for bilingual Data Engineers seeking career progression.
Tracking new hire retention rates enables actionable insights into improving IT staffing efficiency while minimizing turnover risks in critical positions essential for scaling operations effectively.
How to Build a Recruitment KPI Dashboard
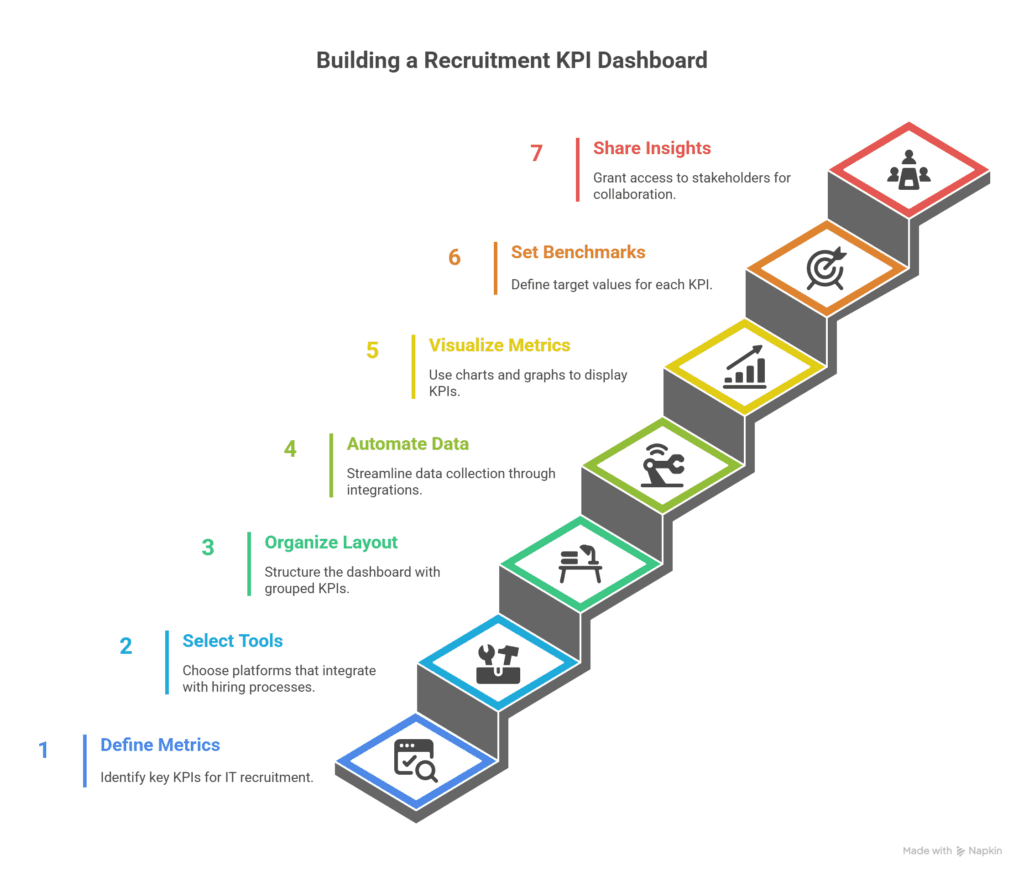
Define Key Metrics for IT Recruitment
Identify the most relevant KPIs based on your recruitment goals. For IT staffing, focus on metrics like time-to-hire, cost-per-hire, candidate quality, offer acceptance rate, and sourcing channel effectiveness. For example, track time-to-hire to measure how quickly you secure roles like Software Developers or DevOps Engineers.
Use cost-per-hire to evaluate financial efficiency in filling positions such as QA Analysts or Network Engineers.
Select Data Sources and Tools
Choose platforms that integrate seamlessly with your hiring pipeline. Applicant Tracking Systems (ATS) can centralize data from sourcing tools. Combine these with technical assessment platforms to capture screening test results for roles like Full-Stack Developers or Database Managers.
Organize Your Dashboard Layout
Structure the dashboard by grouping related KPIs into sections. Create categories such as Sourcing Efficiency (source-to-hire ratio), Screening Performance (technical assessment pass rates), Hiring Speed (time-to-fill), and Candidate Quality (first-year retention rate). Ensure each section provides actionable insights for IT recruiters and hiring managers.
Automate Data Collection
Streamline data input using integrations between ATS platforms and sourcing tools. Configure automation workflows so metrics update in real-time when candidates progress through stages like shortlisting, interviewing, or onboarding. This reduces manual errors while providing accurate insights into bottlenecks in tech talent acquisition.
Visualize Metrics Effectively
Use charts and graphs tailored to each KPI type. Bar charts work well for comparing sourcing channels’ performance across regions like Latin America. Line graphs are ideal for tracking trends in time-to-fill over months for critical roles.
Provide Role-Specific Filters
Enable filtering options by job title, location, or team size to customize analysis. For instance, filter by remote-ready candidates when recruiting Mobile App Developers across nearshore markets. This helps CTOs and engineering managers make informed decisions about resource allocation.
Set Benchmarks and Alerts
Define target values for each KPI based on industry standards or past performance. For example, aim for an offer acceptance rate above 85% when hiring senior-level Web Developers or QA Testers. Configure alerts within the dashboard to notify teams if metrics deviate significantly from benchmarks.
Share Insights Across Teams
Grant access to key stakeholders such as technical sourcers, HR tech specialists, and IT headhunters. Use shared dashboards during strategy meetings to align efforts on scaling recruitment efficiently without compromising candidate experience or diversity hiring goals.
By implementing these steps systematically, you create a scalable framework that optimizes every stage of your IT recruitment process while ensuring measurable outcomes aligned with business objectives.
Turning IT Recruitment KPIs into Strategic Outcomes
Tracking IT recruitment KPIs enables organizations to move beyond guesswork and build a structured, measurable approach to hiring. When used effectively, these metrics help refine sourcing strategies, reduce time-to-fill, and ensure alignment between talent acquisition and business priorities.
If you’re looking to strengthen your IT team with skilled professionals from Latin America, Wow Remote Teams offers a proven recruitment solution. Our team specializes in connecting U.S. companies with vetted remote tech talent across the region.
Book a strategic call to explore how we can support your hiring goals with reliable, cost-effective recruitment.
Recommended Resources
- How to Assess Tech Talent Without Being a Developer
- IT Recruitment: Agency vs In-House vs Freelancers
- Structured Technical Interview Frameworks
- Top Countries to Hire IT Talent in LATAM
- Nearshore vs Offshore IT Hiring
- Common Challenges in IT Recruitment
- Top IT Roles Companies Hire in Latin America
- IT Recruitment Guide for CTOs and Founders
- Top IT Staffing Agencies to Recruit Remote Talent
Frequently Asked Questions
What are IT recruitment KPIs, and why are they important?
IT recruitment KPIs (Key Performance Indicators) are metrics used to measure the efficiency and effectiveness of hiring processes in tech roles. They help organizations identify bottlenecks, optimize resource allocation, improve candidate quality, and align hiring strategies with business goals.
Which KPIs should I track for IT recruitment success?
Essential IT recruitment KPIs include time-to-hire, cost-per-hire, offer acceptance rate, candidate drop-off rate, sourcing channel effectiveness, diversity metrics, and new hire retention rate. These provide insights into process efficiency and talent acquisition quality.
How does tracking time-to-hire benefit IT recruitment?
Time-to-hire measures the duration from a candidate entering the pipeline to accepting an offer. Shorter cycles increase your chances of securing top tech talent before competitors do while improving overall hiring efficiency.
What is cost-per-hire (CPH), and how can it be reduced?
Cost-per-hire calculates the total financial investment required to fill a role. To reduce CPH without sacrificing quality, use automation tools, pre-vetted talent pools, optimized sourcing channels, and strong employer branding.
Why is the offer acceptance rate crucial in IT staffing?
The offer acceptance rate reflects how many candidates accept job offers after completing the process. A low rate may indicate misaligned expectations or poor candidate experience. Improving this metric ensures efficient resource use and better outcomes.
How can I improve my organization’s candidate drop-off rates?
To reduce candidate drop-offs, streamline your application process, enhance communication at every stage, clarify job expectations upfront, and ensure a positive candidate experience through timely feedback loops.
What role do diversity metrics play in technical hiring?
Diversity metrics ensure equitable hiring practices by measuring representation across demographics. Tracking these helps attract varied talent pools while fostering innovation through diverse perspectives within teams.
How does monitoring new hire retention rates impact recruitment strategies?
New hire retention rates reflect how well employees integrate into their roles over time. High turnover indicates issues with onboarding or cultural fit. Optimizing these areas reduces costs and improves long-term workforce stability.
What tools can help track IT recruitment KPIs effectively?
Applicant Tracking Systems (ATS), HR analytics platforms like BambooHR or Workday, and custom KPI dashboards allow real-time data collection and visualization for informed decision-making in IT recruitment efforts.
How can I create a KPI dashboard for IT recruitment?
Define key metrics relevant to your goals (e.g., time-to-fill or diversity ratios). Use reliable data sources like ATS platforms or surveys. Automate data collection for accuracy and organize visualizations clearly to share actionable insights across teams efficiently.